Introduction
In this post, I will go over some details on how I implemented a custom profiler in my homebrew rendering framework.
I use my profiler to gain a general overview of the performance characteristics of my renderer. It helps me validate my ballpark estimates (e.g., ’this should be fast, right?’) and quickly track where slowdowns are originating. The profiler also aids me in medium-to-high-level optimizations as timings tend to be precise enough to capture subtle timing differences. However, it does not replace a dedicated profiler like Superluminal, VTune, or Nsight.
I developed a range-based (or instrumentation) profiler, which means I explicitly add snippets of code to various functions and scopes. If something falls outside of monitored ranges, it remains undetected (particularly noticeable in third-party code). However, these ‘blank spots’ are visible in the visualization, indicating that some activity is occurring.
Usage
As mentioned, a range based profiler needs to explicitly tag functions or scopes to be included. As I do want to be able to completely disable profiling, without changing files all over the project, we simply employ the preprocessor
#if ENABLE_PROFILER
    #define PROFILER_CPU_BEGIN(tag) /*TODO*/
#else
    #define PROFILER_CPU_BEGIN()
#endif
I have defines for PROFILER_CPU_BEGIN, PROFILER_CPU_END, PROFILER_CPU_SCOPE and PROFILER_CPU_FUNCTION. The later use a typical RAII struct to schedule the correct begin/end calls.
For GPU queries, we have a similar set of defines with the exception that they are explicitly typed on (GPU) queue type and require a commandlist. While it could be an interesting exercise to dynamically deduce what queue type we should use, I opted for simplicity here (as in general I know exactly what queue will be used). We will dive into more details about the GPU events later.
A function that is instrumented, will look something like this:
Gfx::RenderTexture* Renderer::Render()
{
	PROFILER_CPU_FUNCTION();
	PROFILER_GPU_GFX_FUNCTION(cmdList);
    //...
Tags
As you might have noticed in the previous section, starting a profiling range requires a tag. A Tag serves as a unique identifier for a range. Initially, I used strings, such as __FUNCTION__, for tags, storing them in a per-frame chunk of data. However, it became apparent that the differences between frames were minimal, resulting in nearly identical per-frame chunks. To optimize this, I store tags globally.
In my implementation, a Tag is generated using the GenerateTag function, which copies a string into a global memory chunk. Allocation within this chunk is managed by a simple (atomic) bump allocator. Currently, I do not perform checks for double entries (tags are typically static local variables), but I can always implement them if needed. Each tag is represented by an unsigned integer indicating its offset in the global storage. 8KB of storage allocated seems sufficient for now (and if not, I’ll double it a few times before a better solution is needed).
To prevent rapid filling of the storage, I handle a special case involving tags that contain a counter. For example on the the main thread, I have a range labeled as ‘Frame X’, where ‘X’ is the frame counter. Since allocating a new tag every frame would quickly fill the storage, I use tag counters to manage this. When passing a valid Tag to the AddTagCounter function, I steal some bits within the unsigned integer to store a counter. Currently, I use a simple 16:16 split for counter and offset. Using some very basic bit logic I can detect this counter and use that counter during the UI rendering.
This system allows us to store more than just the name of the range. In addition to the name’s length, I store a unique color generated by hashing the name. While primarily an optimization, this additional data storage opens possibilities for storing other properties in the future, such as call count, call origin or UI state.
Frame data
Now that we can identify ranges, let’s consider how to store them. A range for me consists of the following properties:
- A Tag (as defined in the previous section).
- A timespan, represented by the begin and end times of the range, stored as CPU ticks in 64-bit unsigned integers.
- An internal index, an unsigned integer used to assist with GPU timings.
- The depth of this sample, as defined by the range stack. While not essential to store (as it could be reconstructed from the timings), it proves to be useful.
Each sample occupies 32 bytes (well technically 28), making it small enough to store tens of thousands of them without a significant memory footprint (although your milage may vary here). I aim to store them in continuous memory to facilitate iteration during UI operations. While an std::vector seems like an obvious choice, it presents challenges with long-running ranges.
Long-running ranges, as one would expect, are ranges that extend beyond a single frame. For example, asynchronous asset importing may take some time, and capturing this is essential. Each range is owned by a single frame: the one that initiated it. This means that a thread can close ranges at any time (importing is fully asynchronous). This has the effect that we do not have a single point in the frame for resizing or reallocating the vector. Slapping critical sections around and calling it a day would have too much impact on performance. Instead, I chose to address this issue by utilizing a page array.
A Page Array is a basic container class designed to facilitate fast, continuous iteration while ensuring stable pointers (iterators?). This is achieved by allocating larger memory blocks and linking them together in a linked-list fashion. Allocation occurs from a page until space is exhausted, at which point a new page is added to accommodate additional elements.
+---------+       +---------+       +---------+
| Frame 1 | ----> | Frame 3 | ----> | Frame 5 | ----> ....
+---------+       +---------+       +---------+
| Frame 2 |       | Frame 4 |       | Frame 6 |
+---------+       +---------+       +---------+
^                 ^                 ^
Root (Page 0)     Page 1            Page 2
Obviously each page holds more than two frames (e.g., I use 4 MB pages), allowing for pseudo-random access and nearly seamless continuous iteration. Although allocating a new page incurs some overhead, the average cost of inserting new elements remains low. While there are drawbacks, the Page Array suits my use case exceptionally well. I refer to it as the Page Array, but there must be another technical or scientific term for this concept (if so, please let me know!)."
Now that we know what to store (ranges) and where to store them (Page Array), let’s delve into how we store them. I could simply atomically allocate a range when needed. This keeps it all tight and at a minimal memory budget. The biggest downside is that we lose track of the originating thread as ranges are not interleaved. Although we could store this information, larger ranges would result in fewer frames per page, leading to inefficient iteration (e.g., in the UI). I prefer to keep ranges from the same thread as close as possible and easily findable, even if it means less tight packing and some memory waste. I opted for predefined range counts per frame, with each thread receiving a predetermined number of ranges, with some exceptions (for example the main thread gets more). Currently these maximum counts are hardcoded but I can always make it dynamically if needed. By maintaining a per-thread counter, we can accurately track the number of ranges seen while getting their starting points or the total number of ranges is trivial. While this approach breaks down at some point, it suffices for my own homebrew engine, where asserts are acceptable.
CPU events
We are finally ready to start capturing ranges! I use a typical push/pop range strategy where we only specify the tag upon pushing (to prevent engine code bloat). This means we have to keep a stack to know the ranges to pop (and it conveniently gives us the depth of each range).
          |---------------------------------|
          | [        Range 0         ]      |  Depth: 0
          |---------------------------------|
          |    [     Range 1       ]        |  Depth: 1
          |---------------------------------|
          |        [     Range 2  ]         |  Depth: 2
          |---------------------------------|
As we will be pushing events from multiple threads (often at the same time), we have to keep a stack per-thread. We can do this almost trivially by using thread-local storage (using the c++ keyword thread_local).
Upon pushing a new range, we grab the current thread’s TLS context and initialize it if needed. The thread TLS context keeps two variables:
- The current thread index. Note that this is distinct from the OS thread ID but rather the index of this thread as seen by the profiler.
- This threads range stack.
Using the thread index, we allocate a range from the threads pre-allocated storage (see previous section). Once we determine the exact index of the range to use, we push that index to our stack to establish the depth. Note that I also push the current frame index to the stack for long running ranges. As mentioned before, we also store this stack’s depth in the range to avoid recalculation later.
Filling the range involves trivial data copies (depth, tag, etc.) but the primary task is capturing the current timing. As I’m developing for Windows, I use QueryPerformanceCounter for this purpose.
Upon popping a range, we perform a similar process: query the TLS context, pop the range stack, and determine the range to close. Closing involves using high-frequency timers again to capture the current time.
That’s essentially it for capturing CPU ranges! There is some minor code to fill in thread info with names, etc. The job system uses this API, but it’s mostly for UI sugar.
GPU Events
Capturing GPU ranges is often similar to the CPU, but with differences in how we capture timings.
Given my homebrew framework’s explicit GPU queues, managing query heaps becomes straightforward as I can always know the queue being utilized. This approach simplifies memory management by treating each queue akin to a CPU thread. Rather than relying on the current thread index, I directly embed the necessary hardcoded (per queue) offsets into pre-allocated memory for range storage. Each thread maintains a TLS context, which includes a stack for managing active ranges. Notably, this stack now also tracks the commandlist required for query closure. These commandlist are owned by the engine and expected to be submitted at some point in the future (but before the Profiler’s EndFrame call!).
I’m not going to go too deep into how to setup query heaps on D3D12 but keep it to some high-level overview. I utilize a single ID3D12QueryHeap per queue type with a predetermined count (again, if I run out I’ll just double it a few times). This query count is actually N times larger then what I expect to capture in a single frame as it is used by a ring buffer mechanism to optimize memory usage.
      [Frame N-1] [Frame N] [Frame N+1]
    |-----------------------------------|
    | [         ] [       ] [         ] |  Query heap
    |-----------------------------------|
    | [         ] [       ] [         ] |  Readback buffer
    |-----------------------------------|
      ^           ^
      Read Idx    Write Idx
Resolving each ringbuffer section data involves using dedicated command buffers, each submitted directly to the appropriate queue. This is obviously not ideal but easy and convenient. A simple fence is used to determine if a section is ready but also to prevent the write index catching up to the read index. To prevent synchronization, the ring buffer size exceeds the engine’s frame count.
After submission of this frames query resolve requests, timestamps from previous frames are processed to update ranges with timing data. Because we have no guarantees that engines commandbuffers are submitted in the same order as ranges are allocated (there is some multithreading happening), the timestamps are sorted and the stack is reconstructed to have proper range depth information. Lastly, I convert from GPU clock ticks to CPU ticks using GetClockCalibration and GetTimestampFrequency.
And that is it. While getting the GPU timers is a bit more involved, we can re-use a lot of the CPU code and data-structures. All we have left to do is visualize our ranges!
Visualisation with dear ImGui
Visualizing these ranges with ImGui is straightforward. I utilize the ImDrawList directly to render boxes, lines, and other elements. The process typically follows a pattern:
- Calculate the size of the rectangle for the “widget” we intend to draw.
- Generate a unique ImGuiID for it, usually by either using ImGui::GetID or raw pointers (for example to the pre-allocated range storage)
- Use ImGui::ItemAdd with the rectangle and ID to inform ImGui about the upcoming drawing.
- Draw the element using available primitive calls in ImDrawList. For custom needs, functions like PrimReserve/PrimWriteIdx/PrimWriteVtx come in handy. I’ve used these to create a variant of DrawLine that allows for different colors at each endpoint.
Managing the current position in the window is something to keep in mind. I employ a simple float2 called cursor for this purpose, incrementing it with the width and height of each calculated rectangle after drawing each item. This cursor can accounts for panning and facilitates high-level culling.
A key takeaway is to establish utility functions or lambdas:
- TicksToScreenSpace converts CPU ticks into screen space, dividing the total ticks in the timeline by the screen width (potentially scaled due to zooming).
- ScreenSpaceToImGuiSpace converts screen space positions into ImGui window coordinates, typically involving adding the cursor position.
- ScreenSpaceToTicks converts back to CPU ticks, primarily used for mouse interaction or ruler legends.
- FormatTimeString converts time into a string. Spend some time by making dynamic precision. If I am all the way zoomed out and so we are dealing with seconds, 0 or 1 digits are typically enough. At that point, I have little to no additional knowledge if it is 1.5 seconds or 1.53 seconds. But all the way zoomed in looking at (for example) drawcalls, the difference between 0.3ms and 0.344ms is relevant!
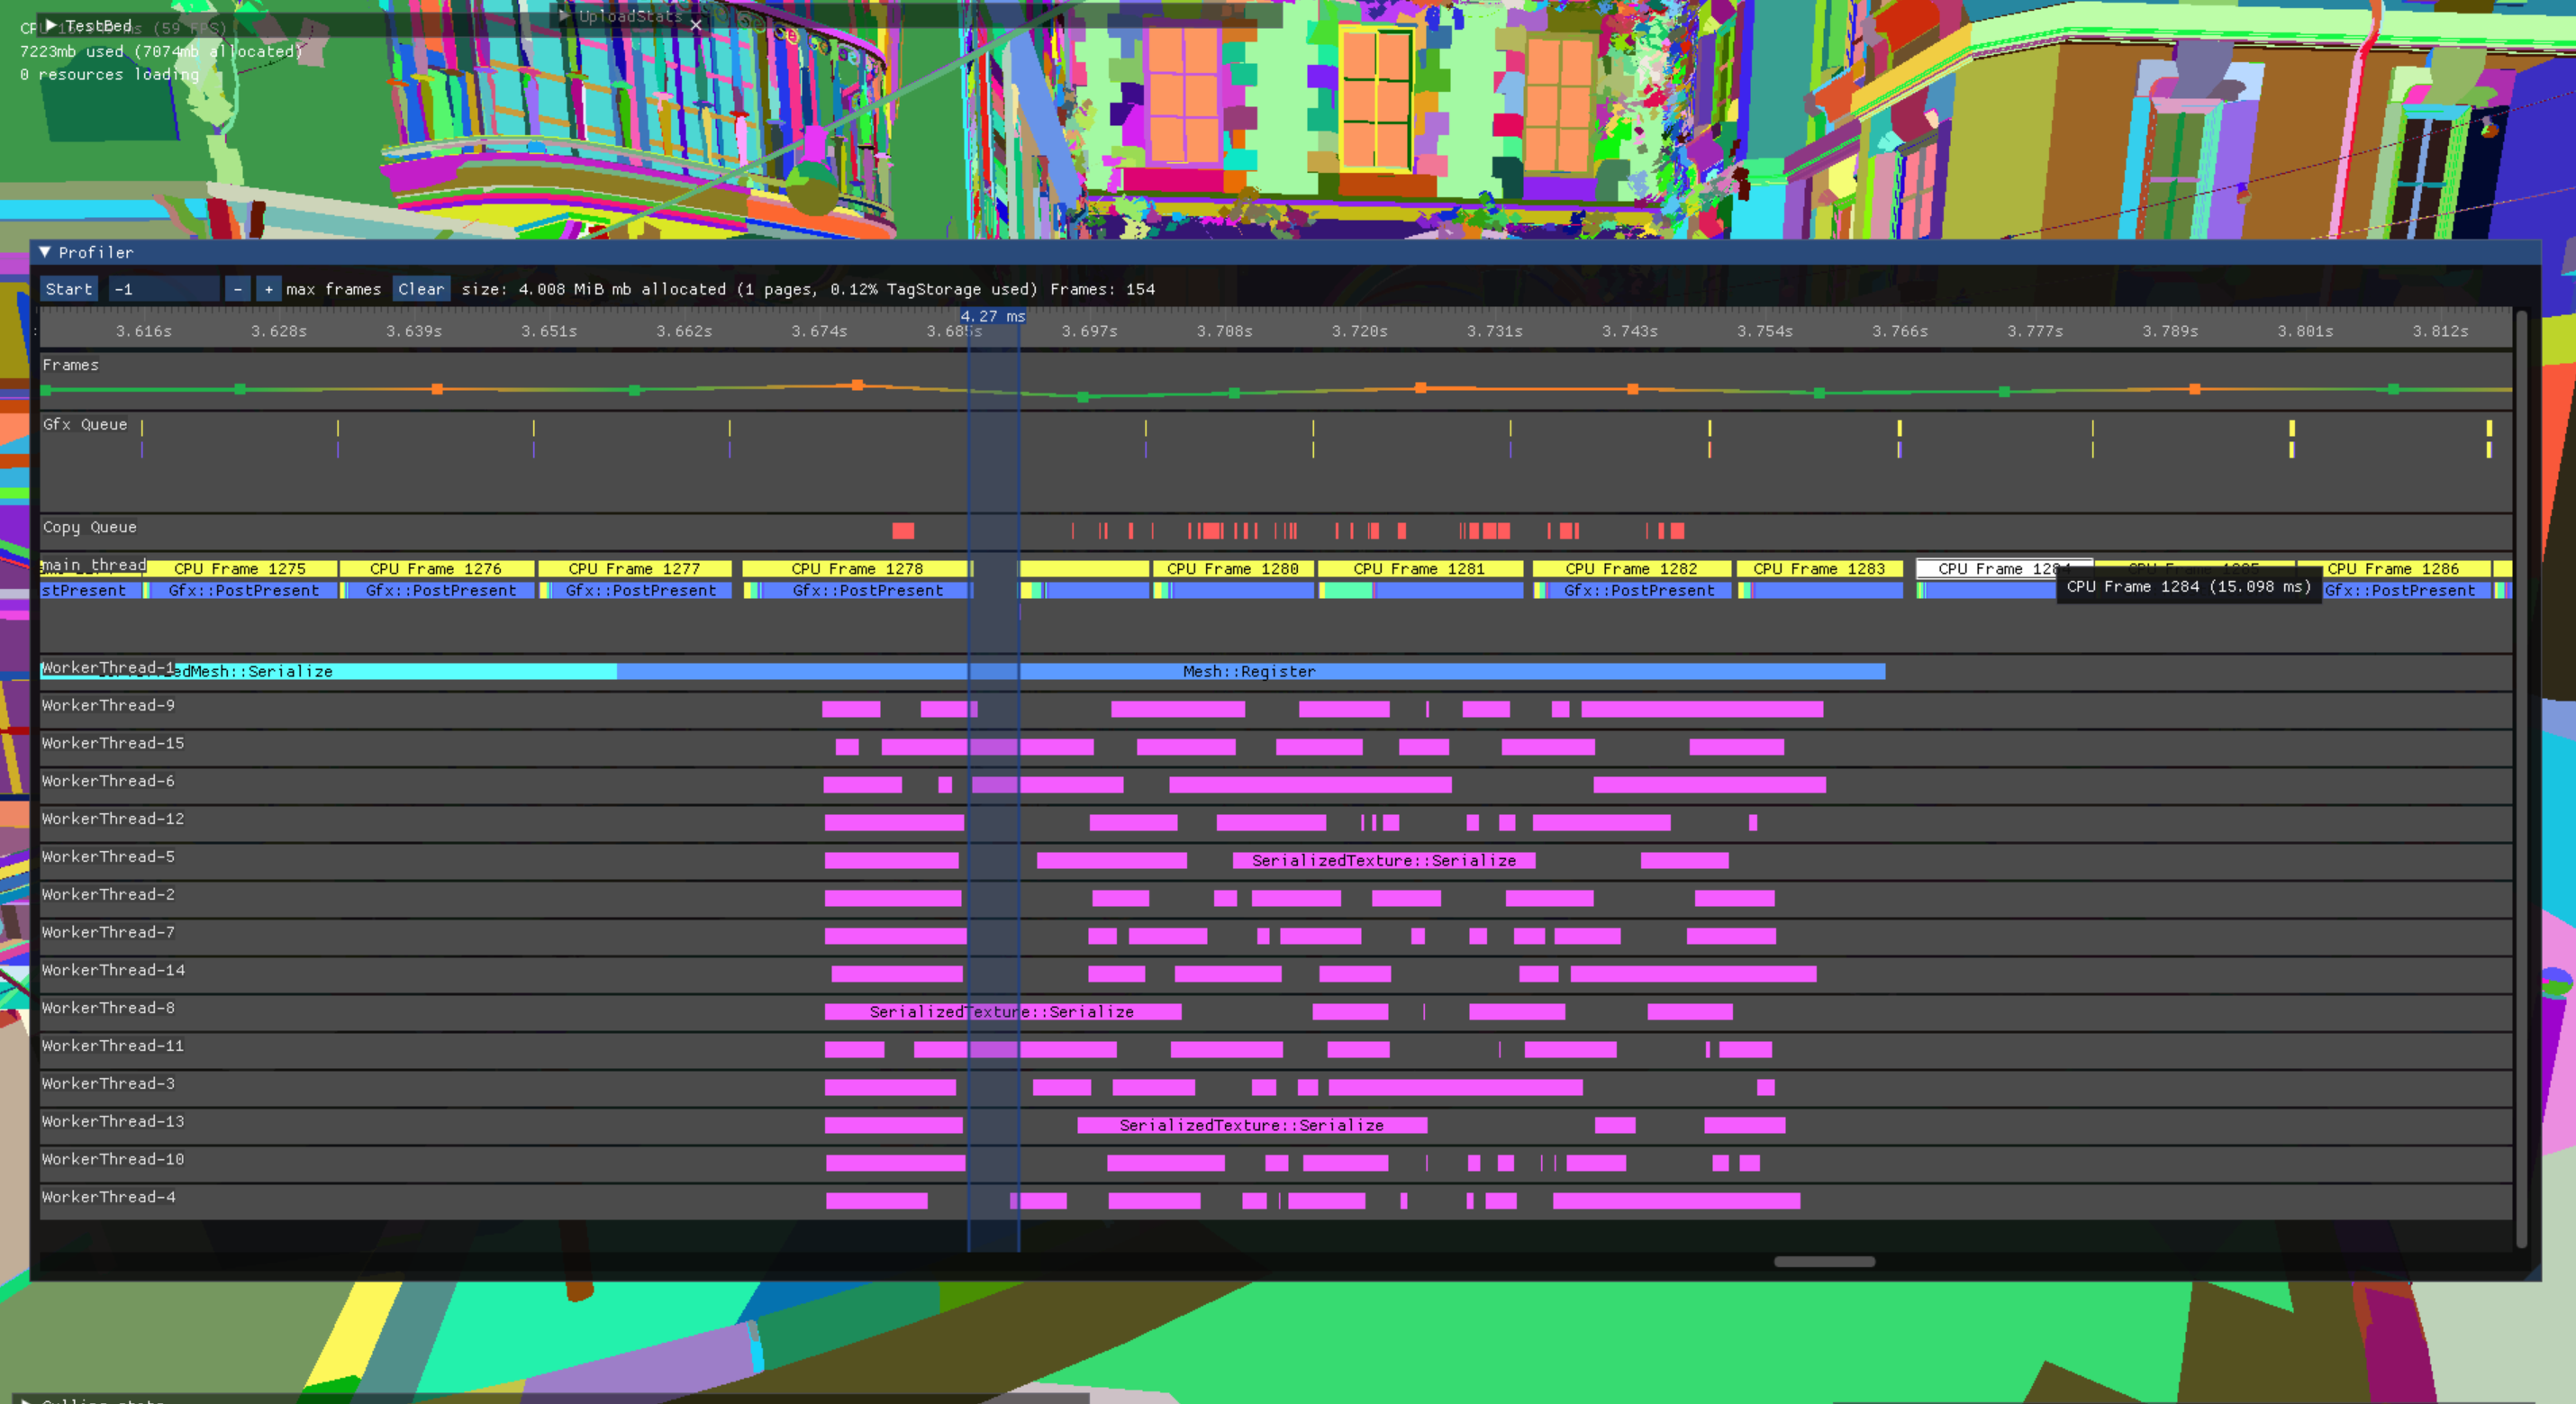
With these in place, it’s a matter of tinkering and refining. I draw a large rectangle for each track (CPU thread or GPU queue), iterate over frames within the current zoom/panning window, and draw the ranges. Additional features like settings, scrolling, shortcuts, or searching can enhance usability. One particularly useful feature is the ability to use the mouse to add rulers and measure time between them.
Conclusion
In conclusion, while I don’t believe I’ve introduced anything radically new or different from existing profilers, the tool offers invaluable assistance in providing a basic overview of performance. Moreover, crafting it has been an enjoyable endeavor. While there’s certainly room for extensive tweaking and system extensions—such as saving captures, differential captures, histograms or deeper analysis—I’m content with its current functionality. Your feedback is greatly appreciated; feel free to reach out via Twitter or using the gmail address ‘debaetsd’.